Brianna Henry is the Acting Modeling Team Lead for Cropland Conservation Effects Assessment Project (CEAP), an effort led by USDA’s Natural Resources Conservation Service (NRCS) to evaluate and inform voluntary conservation across the nation’s working lands. In this Ask the Expert, Brianna answers questions about shifts in conservation adoption and associated effects published in a new regional report series. Findings are intended to help guide conservation policy and program development and help conservationists, farmers, and ranchers in their conservation decisions.

Can you tell us more about CEAP Croplands and how it gathers data?
Through CEAP, NRCS measures trends in cropland conservation practices and associated outcomes over time. NRCS partners with the National Agricultural Statistics Service (NASS) to conduct farmer surveys. By using farmer survey data and modeling, CEAP can assess environmental effects of conservation programs and practices implemented throughout the continental U.S.
NRCS has conducted two previous CEAP assessments, from 2003 to 2006 and 2015 to 2016. And we just published a report series that shares comparison data, on a regional basis, from these two assessments.
What type of information is included in these new regional reports?
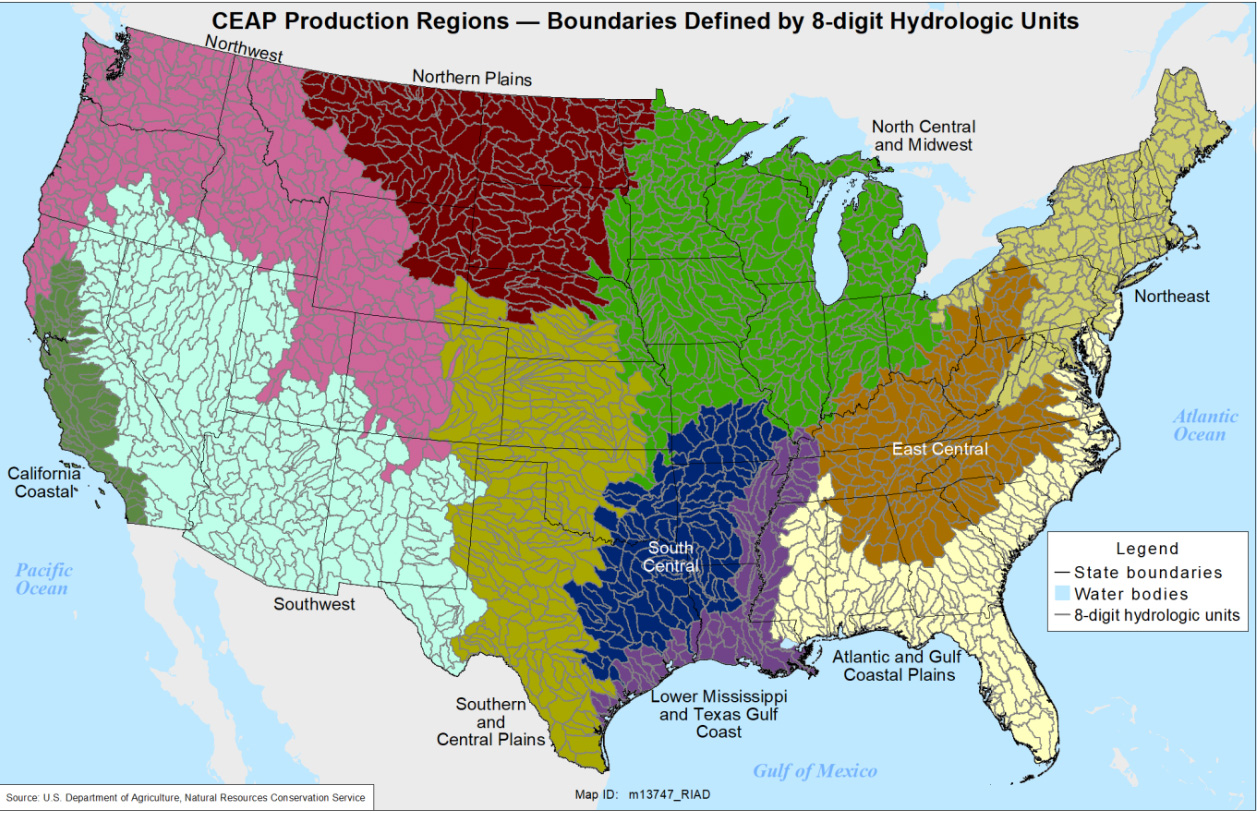
CEAP II data are organized and published based on 11 CEAP production regions. Because the region boundaries are defined by 8-digit Hydrologic Units (HUC), some states are included in multiple reports. (Hydrologic unit codes, or HUCs, identify all the drainage basins in the United States in a nested arrangement, from large to small.) Each report contains information about:
- prevalent land use, cropping systems, and soil characteristics,
- conservation practice adoption, and
- estimated conservation benefits related to resource concerns like erosion, soil carbon gain, and edge-of-field losses of sediment and nutrients.

What are some of the trends you discovered while drafting the new report series?
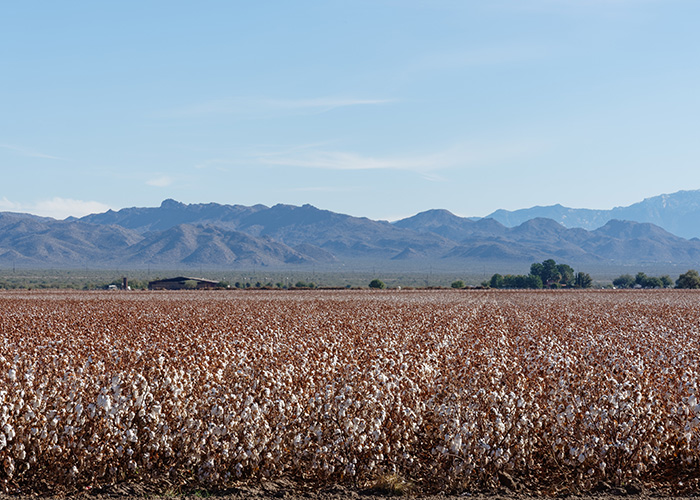
The regional specificity of this series lets us pick up on some interesting trends, by adding the crop and that varies across the country. For example, in the Southwest region, though 80% of acres were still using conventional tillage in CEAP II, there was a substantial increase in use of seasonal conventional tillage, a system in which at least one crop in the rotation is conventionally tilled and at least one crop is conservation tilled (i.e., using no-till or reduced tillage practices) with less soil disturbance. This increase may point to a regional conservation strategy that still meets the needs of the major crops, like cotton and vegetables, that aren’t as well-suited to a no-till cropping system.
Regions like the North Central Midwest, Southern and Central Plains, and Northern Plains represent a large part of the national cultivated cropland (i.e., about 75% of total acres combined) and those large corn and soybean regions tend to carry the national averages. It’s interesting in this report series to see details on some of the smaller regions that vary more from those national trends. Regions like the California Coastal and Northwest saw improvements in nutrient management practices, such as decreased application rates, incorporating nutrients, and applying nutrients at planting. As a result, in both regions, estimated nutrient losses decreased between surveys, counter to national trends.

What new resources can we expect from CEAP croplands in 2025?
There are several exciting things coming up this year that we feel will really provide some valuable data and resources for conservation decision making.
We are beginning our third CEAP assessment (CEAP III), which will take a total of three years to complete. NASS is collecting CEAP III survey data from about 11,500 farmers through February 2025.
And NRCS will launch two public tools in the coming months to provide farmers and others access to valuable conservation outcomes and benefits information.
- Water Quality Benefits Estimator Tool (WQBE): The WQBE leverages data from CEAP cropland assessments to estimate how the adoption of USDA-funded conservation practices impacts wind erosion, edge-of-field sediment losses, and edge of field nitrogen and phosphorus losses. The online tool will provide numerical and graphical data as well as heat maps to spatially show estimated changes over time.
- CEAP II Dashboard: This new dashboard will visually share trends in cropland conservation practices, on a national, regional, state, and HUC2 and HUC4 scale. The dashboard, reflecting data from 2013-2016, includes findings related to structural practices, conservation tillage, cover crops, irrigation, nutrient management, and many other conservation actions.
Check out the CEAP croplands webpage to learn more about currently available tools and resources.
Brianna Henry is the acting Modeling Team Lead for CEAP Croplands for the NRCS Resource Assessment Branch. She may be reached at Brianna.Henry@usda.gov.


